



The Surprise
For most of the last fifteen years, the debate between active and passive investing had a simple, universally accepted answer: pay less, accept the broad market index, and win on average. For the average investor checking their 401(k) or brokerage account, exchange-traded funds (ETFs) have always been synonymous with cheap, passive index tracking. You buy the whole market for pennies, ignore the noise, and let time do the heavy lifting.
But Wall Street has quietly rewritten the script. In 2026, a staggering 80 percent of all new ETF launches are actively managed, fundamentally altering the landscape for everyday investors [1].
These new funds promise the best of both worlds: professional, human stock-picking power wrapped inside the ultra-modern, tax-efficient ETF structure. But there is a massive, compounding catch hiding in the fine print. Active ETFs charge an average expense ratio of 0.69 percent, compared to just 0.10 percent for typical passive funds [1].
That half-percent gap might look like a rounding error, but it is a silent wealth killer. Applied to a $100,000 portfolio over 30 years, assuming identical gross returns, that tiny cost differential will erase roughly $200,000 in foregone compounded growth [1]. Welcome to the new era of active management, where the wrapping is better, but the math is just as brutal.
What the Data Shows
Despite the staggering long-term costs, retail investors and financial advisors are buying the new pitch in droves. In just the first few months of 2026, active ETFs attracted $50 billion, keeping them on pace for a record $600 billion in annual inflows, according to State Street Investment Management [2].
While passive funds still hold the lion's share of total historical assets, the day-to-day momentum has clearly shifted. During periods of market volatility earlier this year, active ETFs accounted for nearly 90 percent of some monthly equity flows, putting them on track to occasionally outpace index products—a historically rare feat [3].
Yet, despite the billions rushing through the door, the foundational data regarding active management remains unforgiving. The most recent SPIVA U.S. Scorecard—the industry's benchmark for tracking manager performance—revealed that 79 percent of actively managed large-cap equity funds underperformed the S&P 500 last year [1]. When the timeline is stretched to a 10-year horizon, only 24 percent of active ETFs managed to beat their stated benchmarks [1].
Investors are essentially paying a premium price for a product that fails to deliver on its core promise of outperformance more than three-quarters of the time.
Wall Street Shift: 87% of New ETFs Are Now Actively Managed
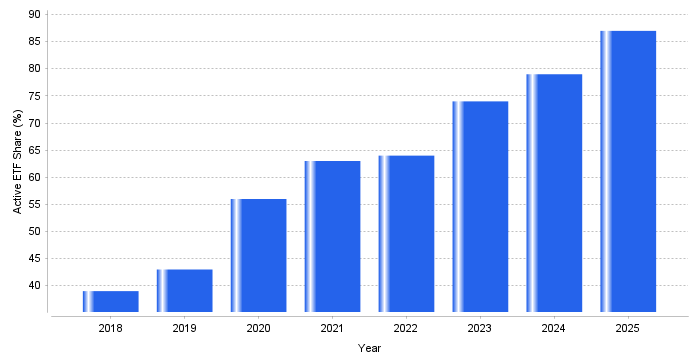
This dataset tracks the percentage of new U.S. ETF launches that are actively managed, revealing a massive shift in Wall Street's product pipeline from 39 percent in 2018 to 87 percent in 2025. The data directly illustrates the article's central claim that the fund industry is aggressively pivoting away from traditional passive index funds toward more lucrative active strategies. For everyday investors, the actionable takeaway is to carefully scrutinize the expense ratios of any new ETF products and actively resist migrating core portfolio holdings into these higher-fee active wrappers.
| Year | Active ETF Share (%) (Percent) |
|---|---|
| 2018 | 39.00 |
| 2019 | 43.00 |
| 2020 | 56.00 |
| 2021 | 63.00 |
| 2022 | 64.00 |
| 2023 | 74.00 |
| 2024 | 79.00 |
| 2025 | 87.00 |
Source: Goldman Sachs Asset Management / Morningstar — Active ETF Launches as a Percentage of Total ETF Launches
The Mechanism
If professional stock pickers consistently struggle to beat the market, why is the active ETF structure exploding in popularity? The answer lies deep in the tax plumbing of the ETF wrapper.
Traditional mutual funds process redemptions in cash. When investors want out, the fund manager is legally forced to sell underlying stocks to raise cash. If those stocks have gone up in value, selling them generates capital gains, which must be legally distributed to all remaining shareholders. This forces everyday investors to pay taxes on gains they didn't even realize.
ETFs, however, operate on a completely different set of rules. As foundational research from the National Bureau of Economic Research documents, ETFs actively manage their portfolios by dynamically adjusting the specific baskets of underlying assets used for creation and redemption [4]. Instead of selling stocks on the open market for cash, an ETF trades underlying shares 'in-kind' with institutional market makers. This unique structural loophole allows active ETF managers to surgically flush out stocks with high embedded gains without ever triggering a taxable event for the retail investor [1].

The real-world financial impact of this mechanism is stark: in 2025, a mere 9 percent of active ETFs distributed a capital gain to their shareholders. For actively managed mutual funds, that figure was a whopping 53 percent [1].
Who Wins, Who Loses
The clear winners of this shift are high-net-worth investors operating inside taxable brokerage accounts. For them, migrating capital from a clunky, tax-heavy mutual fund into a highly tax-efficient active ETF is a mathematical upgrade that saves them thousands during tax season.
Asset managers also emerge as massive winners. Launching and running an ETF carries up to $500,000 in fixed annual operating costs [5]. The industry desperately needs the higher revenues generated by 0.69 percent active fees to maintain profit margins in a world otherwise dominated by zero-fee index funds.
The losers are everyday retail investors who abandon dirt-cheap index funds to chase the new active hype. By swapping a 0.03 percent passive fund for a more expensive active ETF, they are willingly taking on a six-figure compounding headwind for stock-picking odds that heavily favor the house.
Your Move
With the Federal Reserve currently maintaining the effective federal funds rate near 3.64 percent [6], meaning standard cash yields are stabilizing, ensuring your invested capital isn't bleeding out through excessive fees is more critical than ever. Protecting your retirement timeline from the active fee drag requires a quick audit of your portfolio structure:
- Check your expense ratios: Log into your brokerage or 401(k) portal and review the 'Expense Ratio' of your top holdings. Your core market exposure should ideally cost under 0.10 percent.
- Optimize your account types: Never pay for tax efficiency where you don't need it. If you are investing inside a tax-advantaged account like a Roth IRA or a 401(k), the tax-dodging benefits of an active ETF are entirely useless to you. Stick to the lowest-fee passive options available.
- Limit active bets to the edges: If you want to utilize active ETFs, isolate them to narrow, specialized market slices where active management historically has a fighting chance—such as small-cap stocks or emerging markets—rather than broad U.S. large-cap funds.








Comments (18) — Page 2 of 2
Leave a Comment