



Key Points:
- Headline averages for retirement savings are severely distorted by a small percentage of ultra-wealthy accounts; the median balance provides the only accurate benchmark for the typical worker.
- Over half of American households have no dedicated retirement savings accounts at all, reflecting a growing divide between active savers and those relying entirely on social safety nets.
- The mathematical realities of Social Security dictate that it was designed to replace only a fraction of pre-retirement income, making supplemental personal savings mathematically essential for maintaining living standards.
- Navigating the shifting landscape of federal contribution limits, including specialized age-based catch-up provisions, is the most highly leveraged action a saver can take to close their personal savings gap.
When measuring financial progress, human psychology naturally seeks out comparison. People want to know if they are normal, if they are falling behind, or if they are ahead of the curve. In the realm of retirement planning, this instinct drives millions to search for average savings benchmarks by age. However, the data presented in mainstream financial discussions is frequently misunderstood, leading to widespread miscalculation. Relying on the wrong mathematical benchmark can either falsely comfort you into under-saving or falsely panic you into making irrational financial decisions.
This comprehensive guide dismantles the statistical illusions surrounding American retirement data. It synthesizes insights from the Federal Reserve, the Social Security Administration, and major recordkeepers to establish realistic benchmarks. Furthermore, it details the precise mechanical steps required to optimize your savings architecture, taking full advantage of federal contribution limits and tax-advantaged account structures. Whether you are decades away from leaving the workforce or navigating the final sprint toward financial independence, this pillar reference provides the empirical data and actionable frameworks necessary to secure your financial future.
The Illusion of the Average: What Retirement Benchmarks Really Mean
To understand the true state of American retirement readiness, one must first understand the profound difference between a mean (average) and a median. In statistical terms, an average takes the total sum of all account balances and divides it by the total number of accounts. The median simply lines up every account from smallest to largest and selects the exact middle number. Half of the population has more than the median; half has less.
In the context of wealth accumulation, averages are notoriously deceptive. The United States possesses extreme variations in income and capital ownership. A single corporate executive with a massive, eight-figure defined contribution plan can mathematically offset thousands of workers with negligible balances. When major financial institutions release their annual reports, the headline average often dominates the conversation, but the median tells the truer story.
For example, data analyzing millions of defined contribution plan participants demonstrated that the average participant account balance reached $167,970 (as of 2025) [1] [1]. Driven by positive market performance and automatic payroll escalations, this six-figure sum might suggest that the typical worker is well on their way to funding a comfortable retirement. However, peeling back the layers reveals that the median balance for this exact same participant pool was merely $44,115 (as of 2025) [1]. This massive gap between the mean and the median highlights how significantly high-balance savers distort the overall picture.
This statistical distortion becomes even more pronounced when expanding the lens beyond active participants in workplace plans to the entire national population. According to the Federal Reserve Survey of Consumer Finances, over half of American households, 54 percent, report having no dedicated retirement savings whatsoever (as of 2023) [2] [2]. When evaluating retirement readiness, comparing oneself to a skewed average is a fundamental error. If you are benchmarking your progress against an inflated mean, you are comparing yourself to a mathematical ghost.
The Reality Check: The Numbers Most People Do Not Know
Understanding where you stand requires age-specific data. The timeline of wealth accumulation is not linear; it benefits immensely from decades of compound interest. Analyzing median balances across different stages of life provides a sobering but necessary reality check.
For workers under the age of 35, the accumulation phase is just beginning. According to Federal Reserve data, the median retirement savings for this cohort is approximately $18,880, while the average is stated as $49,130 (as of 2022) [2]. Institutional recordkeeper data reflects even more modest beginnings for the youngest workers. For those under 25, the median savings can be as low as $1,948, reflecting lower starting salaries, student loan obligations, and the simple reality of having fewer years in the workforce [1].
As workers enter their mid-career years, spanning ages 35 to 44, earning power typically increases. The Federal Reserve notes a median retirement balance of $45,000 for this group, set against a heavily skewed average of $141,520 (as of 2022) [2]. This is the critical window where compounding begins to show noticeable momentum, provided that consistent contributions are maintained.
During the peak earning years, ages 45 to 54, the divergence between the median and average accelerates dramatically. The median retirement balance for these households is $115,000, while the average leaps to $313,220 (as of 2022) [2]. This gap reflects the compounding advantages enjoyed by high-income earners who consistently maximize their contributions and receive substantial employer matching funds.
The most critical demographic encompasses those in the pre-retirement window, ages 55 to 64. For these individuals, the runway for aggressive accumulation is shrinking. The Federal Reserve data shows the median retirement savings for this group is $185,000, while the average is $537,560 (as of 2022) [2] [2]. While $185,000 is a meaningful sum, it falls drastically short of the estimated capital required to replace a middle-class income for a retirement period that could easily stretch for three decades.
Income levels also play a deterministic role in these outcomes. Individuals with an income of less than $15,000 have average retirement savings of around $25,716, while those earning $150,000 or more boast average balances of $377,488 and median balances of $221,220 (as of 2024) [1] [1]. Furthermore, access to these savings vehicles is far from universal. A substantial majority of low-income workers lack access to any workplace retirement plan, and among those who do participate, participation is overwhelmingly driven by the presence of an employer match [1].
Half of Pre-Retirees (55-64) Have Less Than $185,000 Saved
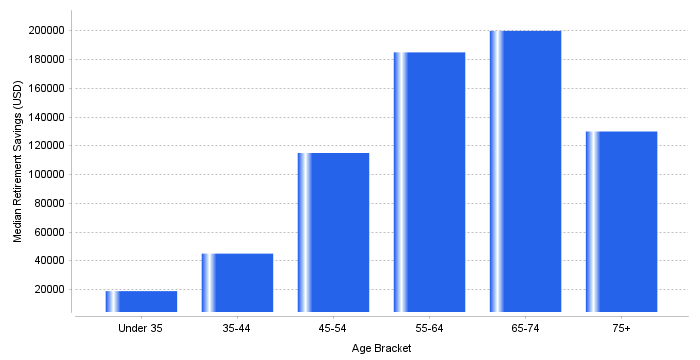
This dataset highlights the stark reality of American retirement readiness by tracking median household retirement savings across age groups. Unlike averages, which are heavily distorted by a small number of massive accounts, these medians show that typical workers enter their pre-retirement years with $185,000—far below recommended targets. Savers should benchmark their progress against these median figures to gain a true assessment of their financial trajectory and to aggressively leverage catch-up contributions if falling behind.
| Age Bracket | Median Retirement Savings (USD) (USD) |
|---|---|
| Under 35 | 18880.00 |
| 35-44 | 45000.00 |
| 45-54 | 115000.00 |
| 55-64 | 185000.00 |
| 65-74 | 200000.00 |
| 75+ | 130000.00 |
Source: Federal Reserve Survey of Consumer Finances — Median Retirement Savings by Age (Federal Reserve SCF 2022)
The Catch-Up Framework: How to Think About Your Savings Gap
Staring at median account balances provides context, but it does not tell you if you actually have enough money to retire. To move from passive comparison to active planning, you must implement a rigorous decision framework. Financial institutions have developed multiple heuristic models to help savers visualize their required trajectory.
The most widely adopted benchmark relies on salary multiples. This framework suggests accumulating a specific multiple of your annual gross income by certain age milestones. A commonly cited model advises having one times your annual salary saved by age 30 [5]. By age 40, the target increases to three times your salary. By age 50, the goal is six times your salary. By age 60, the target is eight times your salary, culminating in ten times your final working salary by age 67 [5].

If you fall behind these milestones, the mathematical solution is straightforward, though behaviorally challenging: you must increase your savings rate. The general rule of thumb suggests saving 12 to 15 percent of your gross pay each year for retirement, a figure that includes any employer matching contributions [1] [1]. If your employer provides a 5 percent match, your personal deferral burden drops to 10 percent. However, if you are starting late, this 15 percent baseline may need to be revised upward to 20 percent or more to mathematically bridge the gap.
Evaluating your savings gap also requires projecting your anticipated expenses in retirement. Many workers assume their expenses will drop significantly once they stop commuting and paying payroll taxes. While some costs decrease, others, particularly healthcare and leisure spending, often increase. A comprehensive framework subtracts your expected guaranteed income streams from your anticipated annual expenses to determine your portfolio withdrawal requirement. If your portfolio cannot sustain that withdrawal rate without facing premature depletion, your savings gap remains unresolved.
The Contribution Blueprint: How to Actually Take Action This Week
Closing the savings gap requires maximizing the capacity of tax-advantaged accounts. The Internal Revenue Service periodically updates the contribution limits for these vehicles to account for inflation and cost-of-living adjustments. Understanding the absolute maximum capacity of your available accounts is the foundational step in taking aggressive financial action.
For the primary workplace savings vehicles, which include 401(k), 403(b), governmental 457 plans, and the federal Thrift Savings Plan, the annual employee elective deferral limit is updated to $24,500 (as of 2026) [3] [3]. This represents the maximum amount of your own salary you can divert into these accounts, regardless of your age. It is important to note that employer contributions do not count against this specific limit. The combined annual defined contribution limit, which factors in both employee deferrals and all employer matching or profit-sharing contributions, extends to a much higher threshold of $72,000 (as of 2026) [3] [3].
Individual Retirement Arrangements (IRAs) offer a secondary pillar for wealth accumulation. These accounts, which can be configured as Traditional (pre-tax) or Roth (post-tax) vehicles, allow individuals to save independently of their employer. The standard contribution limit for an IRA stands at $7,500 (as of 2026) [3] [3]. Because IRA contributions and workplace plan contributions occupy separate IRS limit buckets, a dedicated saver can theoretically maximize both, shielding a substantial portion of their income from immediate taxation.
Health Savings Accounts (HSAs) represent a highly specialized, highly potent third pillar. While nominally designed for healthcare expenses, an HSA offers a rare triple-tax advantage: contributions are tax-deductible, growth is tax-free, and withdrawals for qualified medical expenses are tax-free. Furthermore, after age 65, funds can be withdrawn for non-medical purposes without the standard penalty, effectively turning the HSA into a parallel Traditional IRA. The individual contribution limit for an HSA is $4,400, while the family coverage limit sits at $8,750 (as of 2026) [3] [3].
To put this blueprint into action, financial planners universally recommend a strict order of operations. First, contribute the exact percentage necessary to capture the absolute maximum employer match in your workplace plan; failing to do so is the mathematical equivalent of refusing a portion of your salary [1]. Second, fully fund a Health Savings Account if you possess a qualifying high-deductible health plan. Third, maximize contributions to a Traditional or Roth IRA to expand your tax diversification. Fourth, return to your workplace plan and increase your deferrals until you hit the maximum federal limit. Only after exhausting these tax-advantaged buckets should surplus capital be directed toward standard taxable brokerage accounts.
The Social Security Reality: Edge Cases and Special Situations
The architecture of American retirement relies heavily on the foundation of Social Security. However, a dangerous misconception persists that this federal program is designed to fully replace a worker's income. In reality, Social Security was designed as a poverty-prevention mechanism meant to replace only about 40 percent of the average worker's pre-retirement wages.
The actual payouts reflect this supplemental nature. The average monthly retirement benefit payment for a retired worker is approximately $2,005 to $2,076, translating to roughly $








Comments (2)
Leave a Comment